7. Final stages
Once you have done your research you need to go through two more stages that are covered in this section:
Part A Describing and analysing your findings
Part B Presenting and using your findings
A. Describing and analysing your findings
Throughout the research process you will have been reviewing what you know and making decisions about what you need to find out. The final stages of research are when you begin the more formal process of sorting, selecting, interpreting and representing the data you have collected. This analysis can be broken down into two steps.
- Tidying and organising the data. This should be done when all the data has been collected.
- Interpreting the data to look for answers to your original research questions. This can be broken down into two further steps:
- Extracting percentages, frequencies and quotes.
- Giving meaning to this data – what evidence is there and what does it mean?
Using IT
You need to make some decisions about how you want to organise your data. This can depend on the skills and resources you have available, especially regarding how much you are able to use computer based methods. If you have used an on-line tool to collect your data on a questionnaire, most of these will include a facility to turn your data into statistics, illustrated by graphs and tables. Using an on-line tool makes this part of the research process much quicker and easier and may also be more accurate. If you have used paper questionnaires then you can set up a simple spread sheet on Excel that will help you to interpret your findings. If you are managing your data manually, you need to decide how you are going to do this. One of the main factors is how many responses you have. You need to decide who is going to input the data into whatever system you are using. There are several options you could use.
- You could get a group of you together and share out the questionnaires and each take some away to input the data. If you do this you must make sure that everyone is doing this in the same way – you should sit down as a group and work through two or three completed questionnaires to agree how you will deal with the responses.
- If you have a lot of questionnaires (more than about 50) and/or there are a lot of questions you could consider paying a data inputter. This could be someone you know, a student or a temp agency worker, who you would pay by the hour. This would be someone who would needn’t have any knowledge of your subject but who will quickly and cost-effectively get all the responses entered on to a computer. This is straightforward when you are doing quantitative analysis.
- If you have a large number of open questions and want to analyse these electronically you may need to find an experienced researcher, probably from a university or a public authority, with access to the specialist software that can do this sort of interpretation, such as SPSS, SAS or NVIVO, which are commonly used academic software systems.
If you enter the data into a spread sheet then it is straightforward to use the program software to turn the numbers into graphs and charts to illustrate your report.
However you go about this you will need use these systems for managing and interpreting your data.
See section 4b for links to online surveys.
Tidying and organising data for analysis
After collecting the data it is crucial to spend time organising the questionnaires, notebooks, diaries and transcripts ready for interpreting and making sense of the information you have collected. At this point you will realise how valuable it was to have structured the recording of the data as much as possible.
Organising and tidying consists of a number of steps for each set of data. There are slightly different approaches depending on whether you are using quantitative or qualitative data.
Quantitative data
- Check whether questions have been answered on questionnaires, even if the answer is ‘no reply’ or ‘not relevant’. Weed out any nonsense answers. Don’t be tempted to make up answers.
- Weed out incomplete responses and any respondents that are not part of your target population – for example if you want responses from people who live in a certain area and some of the respondents live outside that area. It is useful to note how many of these responses were ineligible.
- Look for any duplicates – such as where one person, or more likely, one organisation has responded more than once.
- Consider who will analyse the data and whether you need specialist assistance. If you have more than 50 questionnaires with simple questions, or more than 20 questionnaires with complex questions and answers, think about using the IT described above and in section 6. If you are not using a statistical package which codes responses for you, you will need to sort your quantitative data manually. This is described below.
- Use a tally sheet to count responses or a spreadsheet, if you are doing this yourself.
Qualitative data
If you have a lot of qualitative data then it will take time to organise and analyse it. You need to plan enough time to do this thoroughly – there are no short cuts.
- Group the responses from interview transcripts and notes ready for analysis. If you intend to compare the data between different groups for example age, disability, ethnicity or gender, you will need to divide the responses.
- It might be a good idea for one person to read though a small sample and identify some key themes and ask everyone to look out for how many times these occur – as well as looking for other interesting findings (see below).
- Draw up a list of initial categories for qualitative analysis. For interviews, you can do this by grouping all the responses for the same question and noting categories, headings or themes in the margin as they emerge or using a highlighter pen.
- Write quotes you want to use on index cards or on a spread sheet, noting the context in which it was said, and group under the different categories or headings so that you can find them later on. Take note of exceptions and unusual responses and check who said what and when.
- Review notes of meetings, groups and interviews to pull out any themes and patterns.
- If you require numerical information from qualitative data, code the categories from your responses. These would include interview transcripts, notes from observation and responses to open questions on questionnaires.
- You should also include responses to any closed questions which have an ‘other’ response.
The aim is to get the raw data tidy, organised and categorised ready for further analysis.
Coding
Coding means counting up how many responses you have received to each option for each answer. Coding data makes it possible to add, get percentages and eventually compare and contrast your data. On a questionnaire each possible answer to a closed question will need to be coded. It is also possible to code qualitative data if you require numerical information.
Coding quantitative data
On this questionnaire, question 1 is closed with a limited number of responses.
It is coded by allocating a number from 1-5 to each possible response. The code allocated is used to add the total number of each age group responding to the questionnaire.
Example – CV Service Questionnaire
This questionnaire is administered to all clients seeking employment and helps provide information for future service delivery.

| Q1 What is your age? | |
|---|---|
| 18-24 | |
| 25-34 | |
| 35-44 | |
| 45-50 | |
| Over 50 |
| Q2 What is your gender? | |
|---|---|
| Male | |
| Female | |
| Other | |
| Prefer not to say |
| Q3 What is your ethnicity? (describe yourself as you prefer) |
|---|
| Q4 Do you consider yourself disabled? | |
|---|---|
| Yes | |
| No |
| Q5 What qualifications do you have? | |
|---|---|
| GCSE | |
| A level S/NVQ | |
| BTec | |
| Degree | |
| Postgraduate qualification | |
| Other |
| Q6 What is your employment status? | |
|---|---|
| Employed F/T | |
| Employed P/T | |
| Self-employed | |
| Student F/T | |
| Student P/T | |
| Not in employment |
| Q7 How long have you been seeking employment? | |
|---|---|
| Months |
| Q8 Where have you been seeking employment? |
|---|
Statistics
Coding quantitative data is necessary for you to analyse what the data is saying and to draw out patterns. This process enables the data to be counted, added and calculated as percentages. Frequency distributions and averages are statistical tools that can help you to make sense of your findings. It can be helpful, even if you have done all of the rest of the work yourselves, to find someone with knowledge of statistics who can help you with this part of the analysis. However, if you have a head for maths you should be able to use the following information to help you with your analysis. There is more information in the resources pack.
Frequency distributions
A frequency distribution shows the frequency that each answer appears in the interview notes or the questionnaire. Here we show the frequency distribution based on the answers to question 1 on the employment questionnaire (above) giving data on the ages of clients using the service.
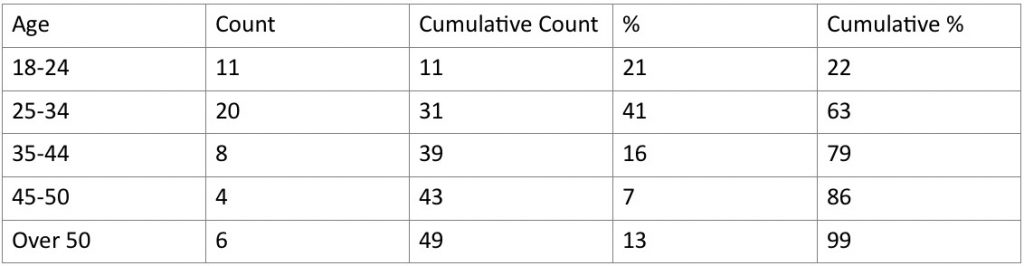
N=49
A few things to explain…
- Count is the number of people in each age group.
- Cumulative count is the total number of people below a certain age limit so, for example, 39 people were aged 44 and under. 43 people were aged 54 and under.
- Percent is the number within each age group as a percentage of the total, so 16% of the people participating were aged 35-44 and 7% were between 45-54.
- Cumulative percent is the cumulative sum in percentage, for example, 86% were under the age of 54.
- N is the total number of individuals counted.
What is an average?
Averages are a very useful way of describing patterns in the data. There are different kinds of averages:
- Mode
- Median
- Mean
The mode
The mode is the most frequently occurring answer in a range of data. It denotes the biggest group. In question 1 of our questionnaire, the age group 25-34 is the most frequently occurring and therefore this is the modal group. The mode is useful to analyse qualitative data after it has been coded or grouped. It fails when data is evenly distributed in two or more categories.
The median
The median is fairly straightforward, but only useful for straightforward numerical data. It is the middle value of a range of data. To find the median you need to have data that you can put in order of ascending or descending rank order, and the point which lies in the middle of the range is the median. With even numbers of values, it is the mid-point of the two central values. In the following set of data, the median is 11.5, halfway between the two middle values. It can be helpful to use the median average if you have one or two answers that are wildly different from most respondents that might skew your data – for example if you want to find how many volunteers are working in local organisations, where there are up to 20 or 30 volunteers in each organisation. However, the local hospital has also responded and is working with 600 volunteers. The mean average (below) would be distorted by that number but the median would not.

The mean
The mean is the total sum of the answers to a question divided by the number of answers.
3 7 15 18 39 55
To calculate the mean:
1 Add all the numbers together = 137
2 Divide this number by the number of categories, 6.
The mean is 137 divided by 6 = 22.8
The employment questionnaire asked people how long they had been looking for employment before contacting the CV service. We can calculate the mean time spent.
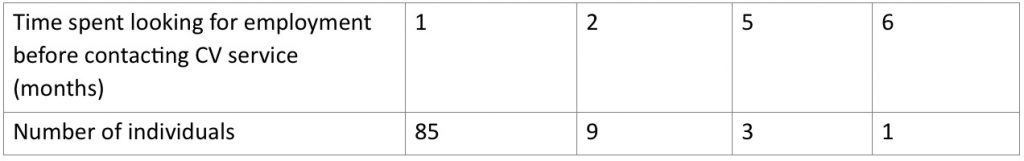
Total no. of months = (1 x 85) + (2 x 9) + 5 x 3) + (6 x 1) = 124
Mean = Total no. of months divided by no. of respondents
= 124 divided by 98 = 1.3 months
Deciding which kind of average to use, and whether to use averages to make sense of your data depends on the purposes of your research and on the research questions you set for yourselves at the beginning.
Coding qualitative data
It is also possible to code some qualitative data and you will find this useful for those open questions on questionnaires, using the methods described above for organising your data or if there are qualitative responses to your questionnaire
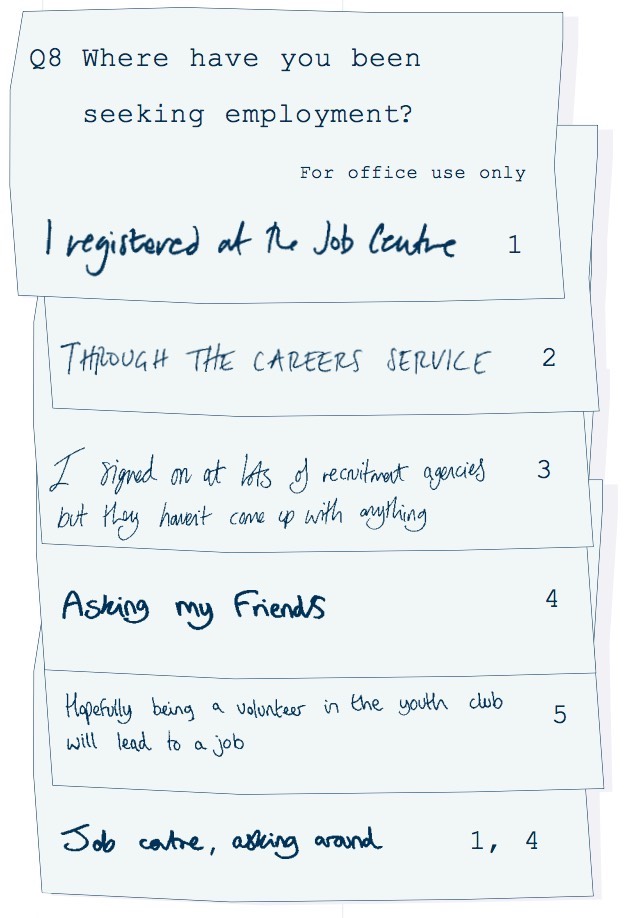
Or you could code using short abbreviations, e.g. JC, Fr, etc.
The same method is used for coding notes in diaries or notebooks. Read through them marking in the margins or with a highlighter pen the issues and findings to which they relate. Then draw up the full list and code.
You have now embarked on the process of studying your data, making judgements and pulling out patterns and themes. By now you should be well-organised, tidy and ready for more in depth analysis. The piles of questionnaires, notes and transcripts have some order. At this point you will be looking for answers to the original questions you set for this research.
Interpreting data
There is a crucial difference between the data itself and the interpretation of the data. This section looks at how to make sense of the data you have organised.
The process of analysis is about working out the story the data may tell. When looking at your data, you will need to look for some of the following patterns emerging:
- Categories
- Relationships
- Themes
- Links
- Contradictions
- Exceptions
- Language
- Interest
- Clusters
- Inconsistencies
- Routines
- Everyday practices
These should all be considered in the context of:
- The effect of race, gender, class, sexuality, age, disability etc. on the data.
- Where the data was collected.
- Who collected it.
- How well informed were the providers of the data.
- What might be their particular interests.
Quantitative data
Once your data is coded and entered onto a tally sheet or a computer software package you can start choosing which frequency counts and percentages you need to calculate to answer your initial research questions. This also applies to any qualitative data you have chosen to code and make numerical.
Qualitative data
The initial categories you have pulled out should be reviewed at this stage. As with quantitative data, the task is to examine the data to answer your initial research questions.
You will need to illustrate your findings by using a selection of quotes or comments. Copy them to index cards or a spread sheet under each question and group them according to your selected categories, themes or headings. Count the number of quotes under each grouping and choose certain quotes that best represent what people in the particular category are saying.
It is likely that you will disagree about what something might mean. The important thing is to remain true to the evidence, rather than to any previously held assumptions. One thing to note is that research doesn’t always give you the answers you wanted! If those of you involved don’t agree by the end, you can always present a minority report. Be prepared to accept lots of discussion that will include a range of interpretations. Your report should reflect this range.
However, if you know your area or your organisation and some of the data doesn’t sound right, do go back and find out why. If you didn’t know that the hospital was one of the respondents to your volunteer survey (above) then you might be surprised by the mean average number of volunteers. To present a true picture of the findings you might want to make it clear that one of the respondents was a large statutory organisation with an exceptionally high number of volunteers.
B. Presenting and using your findings
Often research is done in order to make changes within an organisation: a change of policy, a change of direction or even a change in the structure of the organisation. In this case it is crucial that people in the organisation are involved in the research and feel that they have been listened to and taken seriously. Other pieces of research are addressed to an external audience. Once all the information has been gathered, discussed and analysed you need to tell people about what you have found out.
There are many different ways to communicate information in an effective and efficient way.
Options
- Written report
- Leaflet
- Posters
- Summary report
- Graphics report
- Video
- Presentation to public meetings, local groups, specific groups
- Exhibition
- Local newsletter
- Website
- Email lists
Probably whatever other methods you choose you will also write a report.
Writing research reports
You need to think about what your report is for and who you want to read it. Most people won’t read a long, detailed report and don’t need to see the detail of what you found out. That evidence might be useful for your organisation and other researchers in the future but most readers will just want to see the headlines. If you write a long report always start it off with a short summary of the whole report – no longer than 5 or 6 pages. It can also be a good idea to produce the summary as a stand-alone report that you can circulate more widely than the full version.
A lot of research reports are not read because they are unattractive to look at or contain too much technical language and do not invite a potential reader to turn the pages. You need to write with the target audience in mind, taking into account what they see as meaningful and important to them, e.g. a report to the local authority could use current legislation to provide a context to the research findings. The tone, layout, style and language of the report have to be acceptable to the intended audience. Put as much information as you can, such as details of your methodology, into appendices at the end of the report, rather than in the main body of the document.
When writing your report the following guidelines may be useful:
- Set deadlines for completion of sections.
- Use as few words as possible to say what you mean.
- Choose simple and familiar words.
- Explain things that might be obvious to you but not to an outsider.
- Be precise in what you say.
- Avoid slang words.
- Check the spelling.
- Explain any abbreviations used.
- Use graphics and pictures (make sure you have people’s permissions to use photos).
The structure of a research report
Title page
- You may want an imaginative title that gets people’s interest.
- Author and the group who produced the report.
- The date it was produced.
Summary
- Key points raised in the report.
- Recommendations for what should happen next.
Acknowledgements
- Thank all the people who contributed towards the research process.
- spell all names correctly.
Contents page
- Include all headings and subheadings so people can locate what they want to look at quickly.
- List tables and figures separately after the contents page.
Introduction
- Give the background to the research project and explain what you wanted to find out.
- Describe how you collected the information.
- Explain how you chose your sample.
- Give the response rates to questionnaires.
- Say how you organised any group meetings and say how many people attended.
Body of the report
- Details of what you found out grouped either into themes or topics.
Conclusions
- Brief summary of key points and issues raised through the research.
- Key recommendations for action in light of your findings.
References
- Notes on sources of information used.
Appendices
- Technical information referred to in the report.
- Copies of questionnaires or interview schedules.
- Lists of groups contacted if appropriate.
- Any publicity materials you used during the research.
Read your report and decide if it gives an honest picture of what you found and make sure that any statements or conclusions you have made are supported by evidence from your findings. It is always helpful for the reader of a quantitative report if you state how many people answered each question (it is rare for everyone to answer everything and if there is the opportunity to skip questions then you have not asked everyone to answer all the questions). Also, give the response numbers in percentages and actual numbers. You might show that 25% of respondents said x – but if only four people answered that question, 25% = one person.
Ask someone who does not know about your research to read through and edit the report. The kind of things you could ask them to look out for are:
- Is the material in the right order?
- Is the tone right for the intended audience?
- Is it readable?
- Is the material presented clearly?
- Is it concise?
- Is it complete?
- Are all statements and conclusions backed up by evidence?
- Is it easy to identify key issues?
Publicising your research
In promoting your research you will first need to consider who your audience is. In some instances it will be your own organisation and, at other times, it may be those who plan and resource local services. You may want to hold a launch of the research findings.
Some of the ways to promote the research findings may be:
- Putting it on your website.
- Writing a blog – or asking someone else to who normally writes about these issues.
- Asking partners and other stakeholders to put links on their websites.
- Posting it on various social media.
- Using other social media (e.g. Twitter) to make people aware of where they can find it.
- Public exhibition.
- Press releases.
- Personal contact with reporters.
- Photos in the paper at the launch.
- Local radio interviews and phone ins.
- Posters in local venues and shops.
- Articles in local newsletters.
- Portable displays at events and functions.
- Staging a performance at local festivals, conferences and committee meetings.
- Produce an executive summary of the report and mail to specific people.
- Let ARVAC know about your research – we can use our networks to publicise it.
- Hold a public meeting.
Using your research in your own organisation
Once the research findings are known the research steering group will need to consider the best ways to communicate ideas and plans to the whole of the organisation. Some of the ways to promote research findings to the general public can be used when working inside an organisation.
Whatever you decide, it is important to see the research as part of a wider strategy around managing change that is inclusive and well thought out.